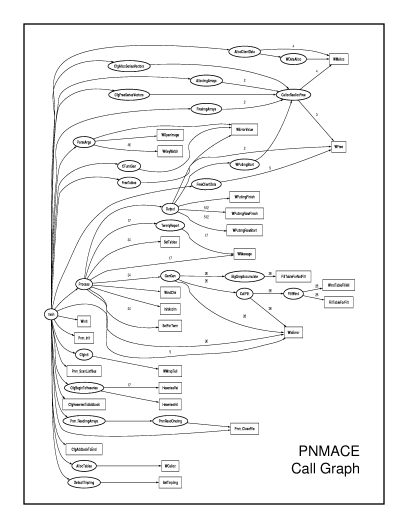
Call Graph. The procedural call graph of the pnmace
program. Numbered edges indicate calls that were made more than
once. Creation method: gprof and Graphviz dot programs, ps
output.
This is a detailed call graph. In contrast with the controller example, which was edited in an interactive drawing package, this was automatically generated by running a profiler on a program, and then processing the results in a package for visualising graphs.
Note that in this case `graph' has the specific meaning of nodes connected by edges.
This example also makes a distinction between interactive drawings and the use of the Adage system as a library for generating output. It is important to remember that it is not an aim of the project to create such a drawing from scratch. The Adage system would render the drawing, but the task of laying out the elements is separate.
